PLACEMENT STATISTICS |
|---|
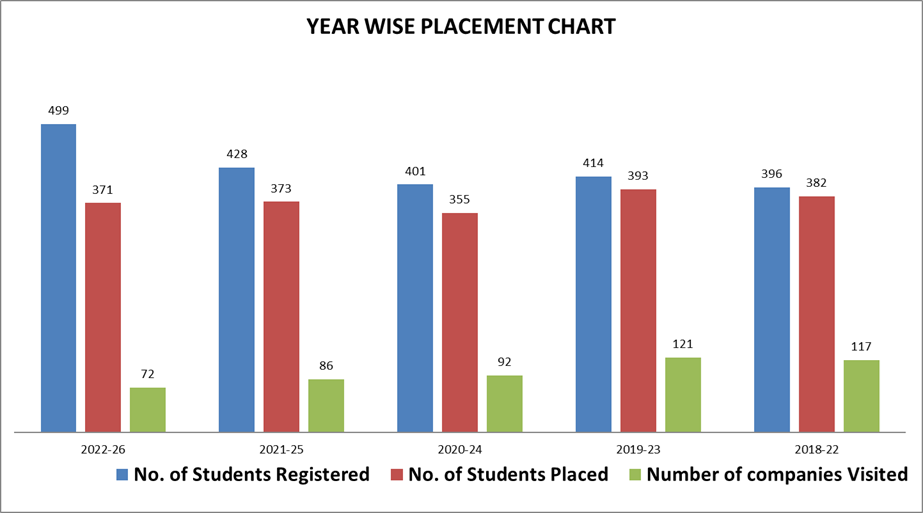
Batch |
No. of Students Registered |
No. of Students Placed |
Number of companies Visited |
Percentage |
|---|---|---|---|---|
2022-26 |
499 |
371 |
72 |
74.35 % |
2021-25 |
428 |
373 |
86 |
87.15 % |
2020-24 |
401 |
355 |
92 |
88.53 % |
2019-23 |
414 |
393 |
121 |
94.93 % |
2018-22 |
396 |
382 |
117 |
96.46 % |
YEAR WISE PLACEMENT CHART |
|---|